


The Hidden Death Toll of San Francisco’s Traffic Policy
A Critical Audit of Vision Zero, Traffic Slowing, and Time-Destruction

Executive Summary
In 2014, San Francisco adopted Vision Zero, an initiative to eliminate all traffic deaths by 2024. Ten years later, not only has the city failed to achieve this goal — it has presided over a record-high number of fatalities, a 50% drop in vehicle speed, and an unquantified but massive human cost in the form of lost time.
This report presents a time-based mortality model that reframes how we assess public policy. Using conservative assumptions and real-world travel data, the results show that the city’s approach to traffic safety has not only failed to reduce deaths — it has led to the annual destruction of over 130 full human lifetimes in wasted time alone.
---
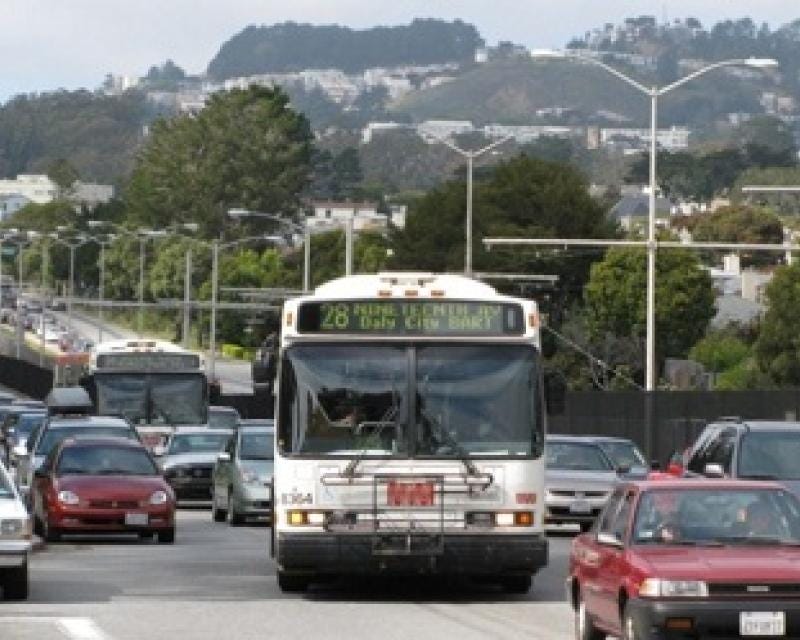
1. Vision Zero: A Failure by Its Own Metric
In 2014, San Francisco launched Vision Zero, a traffic policy initiative aiming to eliminate pedestrian and traffic fatalities within 10 years.
But instead:
In 2024, San Francisco recorded 41 traffic-related deaths, including 24 pedestrian deaths, the highest total since 2007
https://www.sf.gov/data--traffic-fatalities
Since 2014, approximately 299 people have died on San Francisco’s streets
https://www.sf.gov/data--traffic-fatalities
This is not a success story — it’s the opposite of what Vision Zero promised.
---
2. Streets Have Slowed — But Deaths Have Increased
Despite more than a decade of traffic-calming measures, including:
Lane reductions
Signal retiming
Speed limit decreases
“Slow Streets” initiatives
…there is no meaningful correlation between slower traffic and fewer deaths. In fact:
2024 saw more fatalities than 2014
Many of the deaths now involve emboldened pedestrians crossing unsafely in low-speed zones
Traffic has not been diverted safely. It has simply spilled into residential areas, creating new dangers
---
3. The Speed Collapse: From 30 mph to 14 mph
San Francisco is now one of the slowest cities in the U.S. to drive in:
Average travel time to drive 6.2 miles (10 km):
25 minutes and 37 seconds — about 14 mph
https://www.tomtom.com/traffic-index/san-francisco-ca-traffic/
Historical average city speeds were closer to 30 mph, particularly on major arterials with timed lights
That represents a 50% reduction in operational traffic speed: a collapse in basic transportation efficiency.
---
4. The Time-Death Model: Hidden Human Cost
Using basic assumptions:
2 million vehicle trips/day
Average trip length: 4 miles
Time per trip doubled (from 8 mins to 16 mins)
8 extra minutes lost per trip
We calculate:
➤ 16 million minutes lost per day
➤ 5.84 billion minutes lost per year
➤ Average human lifespan ≈ 42 million minutes
➤ Equivalent of 139 full human lives lost per year, in time alone
This is a conservative estimate. More aggressive assumptions (15 extra minutes per trip assuming a 6 mile trip) produce a death-equivalent of over 260 lives per year.
This means the city’s policy has a hidden death toll that exceeds the actual fatality count — by an order of magnitude — every single year.
Even if we assume a quarter the number of vehicle trips (which would mean rideshare is 20% of all trips, something any casual driver in SF can see is not true), we are still looking at 35-65 lifetimes worth of wasted time per year.
---
5. The Ethical Inversion
If a policy directly caused 139–260 deaths per year, there would be outrage, investigations, lawsuits.
But when the damage is:
Spread across the city
Paid in minutes instead of blood
Framed as “progressive” or “green”
…it becomes invisible — but no less real.
Slower traffic does not save lives. It kills them indirectly by draining time — the one thing every human has in limited supply.
---
6. Recommendations
A. Reassess Traffic-Calming Measures
Target actual risk zones rather than blanketing the city with slowdown infrastructure.
B. Conduct Full Time-Cost Impact Assessments
Include time-loss in environmental and transportation reviews.
C. Repeal Blanket Policies That Have No Clear Benefit
Policies like blanket speed reductions and corridor slowdowns should be tied to measurable safety outcomes — or rolled back.
D. Reintroduce Efficiency Metrics into Civic Planning
Efficiency is not anti-equity — it's pro-human. A city that runs slowly harms everyone, but especially working people and those who rely on services that now arrive late.
---
Conclusion
San Francisco’s transportation policy has become a textbook case of well-intentioned governance gone catastrophically wrong. It has:
Failed to reduce fatalities
Slowed down the city’s economic engine
And wasted hundreds of millions of hours of residents’ lives
A policy built on the premise of saving lives has, in practice, become a machine for destroying them quietly.
This is not safety. It’s the bureaucratized erosion of livability, disguised as virtue.
Comprehensive Traffic Volume & Impact Analysis for 19th Avenue, San Francisco
Population-Based Traffic Demand:
* Richmond District (official figure): 60,000
* Sunset + Forest Hill + Parkside + West Portal + St. Francis Wood: 250,000
* South of Sloat (Parkmerced, SF State, Ingleside): 50,000
* Total West Side catchment: 360,000 residents
Assume 50% of residents drive = 180,000 drivers
At 2 trips per day = 360,000 total trips/day
Assume one-third use 19th Ave = 120,000 vehicle trips/day just from the West Side population
Lane Volume and Flow Estimate:
* 6 total lanes (3 in each direction), 25 blocks
* 120 cars per block (peak), flowing 3 full rotations/hour
* Peak hours = 108,000 vehicle movements
* Midday = 54,000
* Night = 54,000
* Total = approximately 216,000 vehicle trips/day
Pavement Wear-Based Estimate:
* Roads are designed for about 1 million ESALs per year
* Based on observed repaving frequency (once every 1-2 years per segment), we assume actual ESAL load equals or exceeds 1 million/year
* Weighted average ESAL per vehicle = \~0.02
* 1,000,000 ÷ 0.02 = 50 million vehicle passes/year
* That’s approximately 137,000 vehicle passes/day
Transit and Ride-Share Ridership:
* Muni 28/28R bus ridership: \~16,200 daily riders
* Estimated ride-share (Uber/Lyft) trips: \~100,000 per day citywide
* Assuming one-third are west-side trips: \~34,000
* Combined: \~50,000 people not using personal vehicles
* With 360,000 West Side residents, this implies over 85% of trips are via private car
Time-of-Day Flow and Weekend Traffic:
* Night traffic flows faster, meaning higher volume is processed during those hours
* Weekends see bumper-to-bumper traffic from 9am to 6pm
* SFMTA’s estimate does not account for weekend or overnight flows, further undercutting its accuracy
Final Summary of Estimated Daily Traffic on 19th Ave:
* Population-based: 120,000–140,000 trips/day
* Lane capacity and vehicle flow: 180,000–216,000 trips/day
* Pavement wear-based estimate: \~137,000 trips/day
* Transit/rideshare removes only \~50,000 trips from the total
* City’s official estimate: 66,000 trips/day (unrealistic by all comparisons)
Conclusion:
Every reasonable method of estimating traffic volume—demographic modeling, lane use, engineering-based wear, observed transit use, and real-world observation—points to daily traffic on 19th Avenue being at least 2 to 3 times higher than the city’s official figure of 66,000 vehicles. A conservative real-world floor is 140,000, with high probability that actual daily traffic exceeds 200,000 vehicles.
This undercount misinforms policy decisions about safety, infrastructure, congestion management, and funding priorities. It falsely justifies road diet strategies and traffic calming policies while concealing the actual load being handled by the West Side’s primary north-south arterial.
Thank You, Aaron.
I have read this analysis intently, and have nothing to suggest, other than for all persons to carefully assess the relative utility of their location and transport choices in this world of gradually constricting options.
;-(