

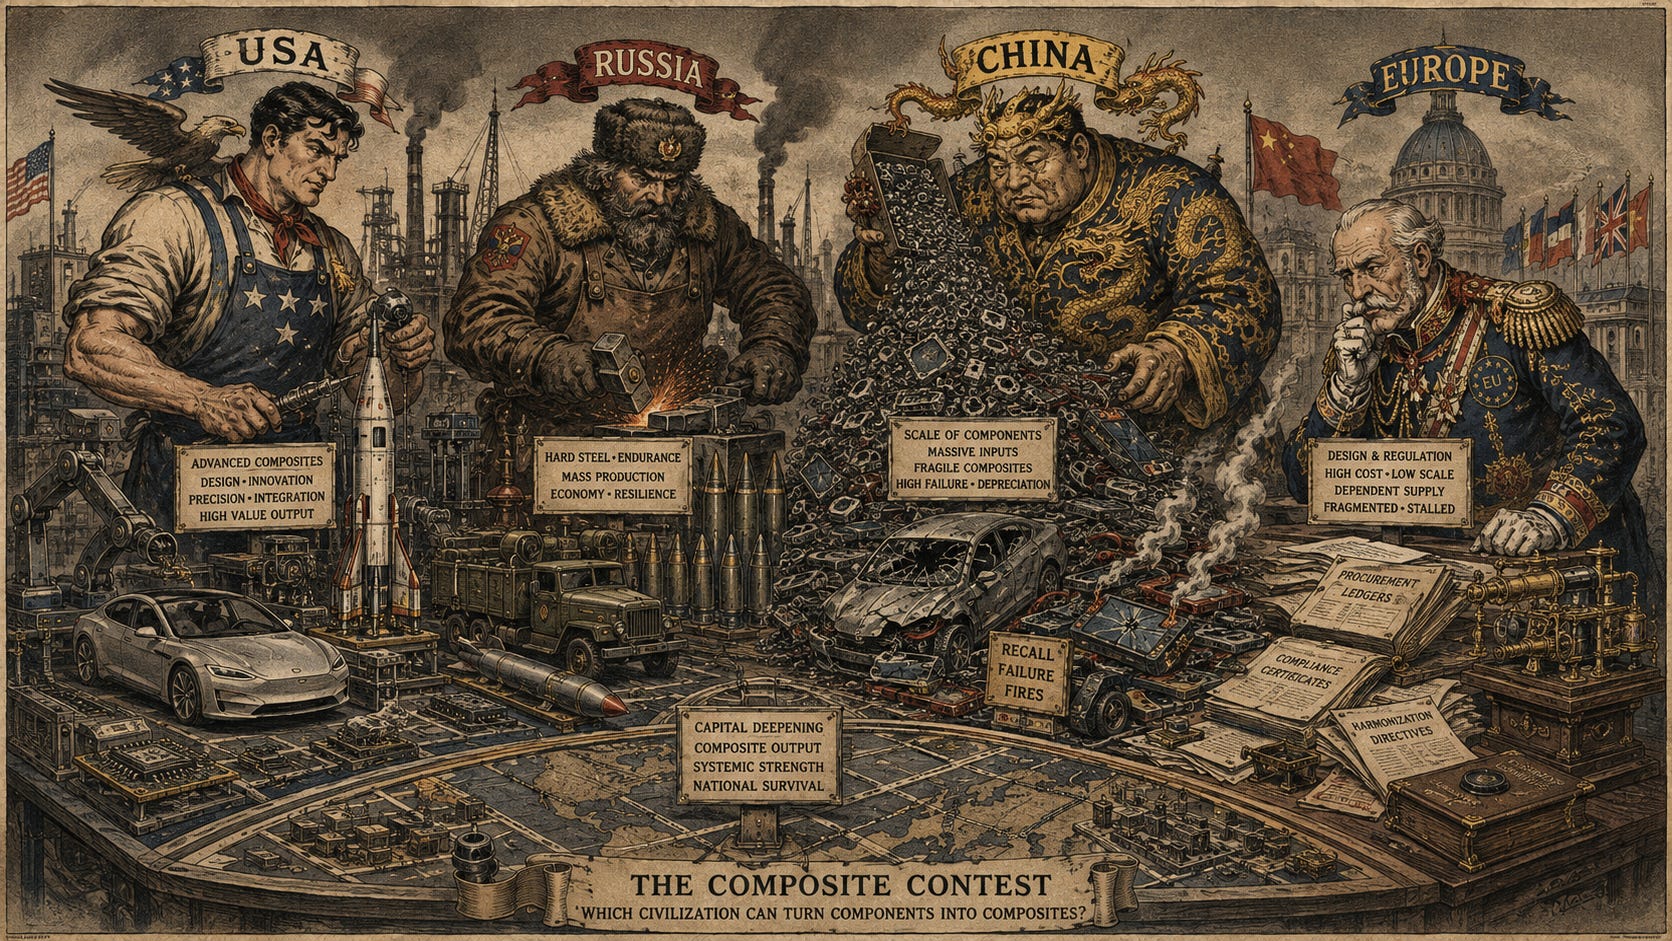
Since exchange rate has already been demonstrated to be an unreliable way to measure true comparative manufacturing capabilities between the superpowers, we need to triangulate to find PPP.
Ideally we compare product to product, price to price, and exchange rate to rate, and then come up with a comparison.
We have already evaluated this idea in Swing Production:
Swing Production

One trait superpowers possess that great powers lack is industrial swing production.
We’ve focused on military hardware, but we don’t have access for that for China. But we have other data. We can compare a BYD for example.
2026: Tesla: $38,360
https://www.tesla.com/model3-choose
2016: Tesla Model S: $67.2k
Resale now: $15.55k; 23%
2026 BYD: 110,000 RMB
https://cnevpost.com/2026/08/11/byd-launches-2027-seal-06/
2016 BYD: 370k RMB
Resale Now: 25.8k, 7%
https://data.carnewschina.com/database/byd/byd-e6/2016
https://car.autohome.com.cn/2sc/china/biyadi/biyadie6/a0_0msdgscncgpi1lto3cspexe5r1
2.8675 RMB to USD rate by this measurement.
But 3x or so differential in value preservation in favor of Tesla.
2024-2026:
~96,700 Dolphin/Yuan Plus vehicles in September 2024 for a steering-controller manufacturing flaw that could lead to overheating/fire;
115,783 vehicles in October 2025 for motor-controller design problems and battery-sealing/manufacturing issues;
88,981 Qin Plus DM-i vehicles in November 2025 for battery-pack consistency problems;
plus 6,843 Fangchengbao vehicles in January 2025 for a fire-related risk.
About 308k deadly flaws in this run.
China’s own regulars recognize they’re crap:
https://www.samr.gov.cn/zw/zh/art/2024/art_32cccf03b3624afcb508c7453f1170fc.html
https://www.samr.gov.cn/zw/zh/art/2025/art_4346e26ed0704a69a5c0b14ab1854534.html
Tesla’s most recent serious recall was software related, corrected quickly, and not hard-industrial related the way BYD failures are.
Even the Chinese recall of 3m Teslas over the door handle thing, is a minor component compared to major systems that literally make the car go and controllable, like steering and batteries! This is fixed with a sticker!
Yes, we know that in general Teslas are not up to the standard of internal combustion engine vehicles. But we are comparing electric vehicle to electric vehicle. No matter the reputation of Teslas in the US, there is not a lot to compare them to when evaluating their reputation.
This is why we stick to quantifiable data. 1.77m in 2024, 4.6m in 2025, 1.8m for 1H 2026; for 8.17m cars.
https://www.jalopnik.com/2226036/best-electric-vehicle-brand-manufacturer-in-world-2026-byd/
https://tridenstechnology.com/byd-sales-statistics/#h-how-many-cars-did-byd-sell-in-2025
BYD: 308k deadly flaws / 8.17m cars is 3.77% deadly flaw rate per car.
Tesla: 4.28m units from 2024-2026 H1. Basically no deadly mechanical flaws, but a bunch of weird crap business quality elements.
We can’t even ratio it. At best we can use the resale data as a proxy for the 2016 BYD depreciation and use that. 23%/7%=3.28 PPP adjustment.
But that doesn’t work. We have to add something in for the DEADLY FLAW RATE.
We should be able to worsen the PPP by at least 1, but I will call 2 coefficient.
2.8675 Base RMB to USD * 3.28 resale PPP proxy adjustment * 2 Deadly flaw coefficient = 18.811 RMB:$USD PPP.
Fine, you don’t like my deadly flaw coefficient? Will you just add it? So that would make 11.40:$USD PPP.
But that’s totally not a fair application of the PPP rule. Even with a 1, the argument is basically that the BYD is twice as bad. 2 means 3 times as bad.
We can compromise: 11.4+18.811 = 30.21/2 = 15.1 RMB:$USD PPP for this product category.
This makes the RMB 15.1/6.74=2.24 times worse than exchange rate suggests. Just for this product category.
And even if you hate that, use 11.4 because I won’t accept less. You need to compute the massive composite failure and recognize that since Tesla imports some of these same components, it says something terrible about how Chinese enterprise uses parts. Then it’s 6.74/11.4= 59.12% of purported face value of RMB.
Compare that with the Russian truck example of about 15:$USD, and we see that given the 82:$USD nominal exchange rate, that the Russian composite does the opposite: the Ruble PPP for complex composites is 5.4666 times more.
Russia Outspends The USA On Arms By 2 To 4 Times, But All You Want To Talk About Is The Missile Gap

Despite what you’ve read in the news, the real issue is not that the US is low on missiles.
Rheinmetall Trucks: 500k Euro, 33k lbs; 15.15 Euro/lbs ; $17.69/lbs
Kamaz: 5m Rubles, 20k lbs; 250 RUB/lbs ; $3.023/lbs
Rheinmetall is 5.8535 times more expensive per lbs for an industrial PPP 5.8535x worse or about 17.08% of Euro face value.
Chinese capital depreciation shows that I’m not just harping on them or cherry-picking.

PRC Depreciation:
24% capital machine depreciation rate.
8% building depreciation rate.
https://www.usitc.gov/journals/entire_journal_2010_11_4.pdf
USA Depreciation:
BEA/Hulten-Wykoff-type economic-depreciation estimates put industrial structures around 2.85% annually, with many other nonresidential structures around 2–3%. Industrial machinery varies by type—roughly 10.3% for metalworking machinery and ~15% for general-purpose/special-industry machinery
Machinery: 12.5%
Building: 2.5%
https://www.bea.gov/sites/default/files/methodologies/Fixed-Assets-1925-97.pdf
Russia Depreciation:
Machinery: 12.5% (even better than US standards in many areas... down to 5%
Buildings: 2-3%:
https://cpcongroup.com/insights/article/fixed-asset-useful-life-table/
155mm/152mm Artillery Shell Production Cost:
USA: $4k
Europe: 8k Euro / 1.1678 USD : Euro = $9342
Russia: 100k Rubles / 82: $1219
PPP Ratios by artillery:
USA/Europe: 2 Euro : $1USD
USA/Russia: 25 RUB : $1USD
Russia/Europe: 12.5 RUB : Euro
Russia Is Producing More Artillery Shells Than All of NATO Combined

The fog of war doesn’t just reference battlefield conditions, it also references information conditions.Thanks for reading Autodidact Obsessions! Subscribe for free to receive new posts and support my work.
Cars/Trucks: RMB 15.1:$USD, RUB 15:$1USD
Artillery Shells: 2.3355 Euro : $1 USD; 25 RUB:$1USD
PPP Currency Value Change
2026 RMB $ PPP Estimate: 15 RMB : $1USD
2026 RUB $ PPP Estimate: 15 RUB : $1USD
Capital Goods depreciation of installed base is much harder to calculate. But we can estimate the value of the new production of base after 3, 5, 7, and 10 years.
We can also add cumulative value during that period.
USA: $4.551t, 12.5%
3: 4.551t+3.982t+3.484t = $12.017t
5: 3.048t+2.667t = $17.732t
7: 2.334t+2.042t = $22.108t
10: 1.787t+1.563t+1.368t = $26.826t
China: 53t RMB, 24%
3: 53t+40.28t+30.61t= 123.89t RMB $Nominal $18.43t/ $PPP $8.259t
5: 23.265t+17.68t=164.835t RMB $Nominal $24.529t/ $PPP $10.989t
7: 13.438t+10.213t=188.486t RMB $Nominal $28.04t/ $PPP $12.565t
10: 7.76t+5.899t+4.483t=206.628t RMB $Nominal $30.74t/ $PPP $13.775t
Russia: 32.56t RUB, 12.5%
3: 32.56t+28.49t+24.928t=85.878 RUB $Nominal $1.038t/ $PPP $5.7252t
5: 21.812t+19.08t=126.77t RUB $Nominal $1.532t/ $PPP $8.451t
7: 16.7t+14.612t=158.082t RUB $Nominal $1.911t/ $PPP $10.5388t
10: 12.786t+11.187t+9.789t=191.844t RUB $Nominal $2.319t/ $PPP $12.789t
When looked at nominally, China’s values look very strong. But when we look from a PPP point of view, we see that China is actually half the US’s and that Russia and China are peers.
Euro: 2593b Euro, 12.5%; PPP anchored to Russian Truck Production
3: 2593+2268+1985=6,846b / Nominal USD $8t / PPP $1.163t
5: 1737+1519=10,102b / Nominal USD $11.8t / PPP $1.717t
7: 1329+1163=12,594b / Nominal USD $14.709t / PPP $2.14t
10: 1018+890+779=15,281b / Nominal USD $17.848t / PPP $2.597t
We are using a worst case scenario for the Euro for PPP. But the brackets show they are horrible. Artillery and heavy trucks and no swing production and demonstrated bad ICOR on arms.
Even if we want to rescale that, we have to use some factor. There are too many categories where Europe is just not anywhere close to the USA. Double it. Triple it. Ok, still terrible figures. Still weaker than Russia and China.
So we can see that cumulatively that Europe and China’s weaknesses are not anomalous, but reveal severe problems with their industrial chains. Europe cannot scale and China scales garbage.
What looked like relatively ‘weak’ US production rates now look extremely menacing. By the most aggressive standard, US fixed investment is almost the same size PPP as Russia, China, and EU cumulatively.
This is simply another triangulation demonstrating why Europe is not in the first rank of powers anymore. Even its vaunted industrial chain turns out to be mostly illusory.
I take this for prima facie because we see Europe doesn’t have an Nvidia, SpaceX, Tesla, Amazon, Broadcom, Apple, Alphabet, Meta... Boeing, Intel, AMD, Qualcomm, Caterpillar, etc.
Siemens 287b Euro
Schneider 188b Euro
Airbus: 187b Euro
AstraZeneca: 239b Euro
These are the biggest industrial companies in Germany, France, and UK. It’s not great in comparison to the US.
We can see from new composites that Europe just can’t keep it up. 24% of the $200b European procurement budget was fulfilled in Europe, which means 76% was imported and not European production.
What this tells us is that we can use the PPP of composites to directionally see the state of an economy. Can they transition from components to composites? What is their PPP as it transitions? Is it better or worse than exchange rate and PPP average?
The data tells us that the USA is the clear leader, Russia is a proportionate follower (half the size, half the capital deepening), and China is rapidly falling apart, despite component scale.
This is another example that demonstrates the changing balance of power between the superpowers and in the case of Europe, a former superpower.
It also shows the strategic cycle is different from the market cycle and that Europe’s military industrial de-industrialization of the 1990s turns out to have been retroactively partially responsible for Europe’s decline as a center of global influence and frontier industrial power.
